
Temporal Variation In Non-Ionising Radiation At A Single Location (part 6)
Further analysis of the GQ Electronics EMF-390 multifunction meter output: measurements made without the blasted USB cable

Back in part 4 of this series I penned this para after contemplating the time series for the electric field (EF) as measured at my office window:
Here we have the daily profile of electric field (EF) strength as measured by the device in the corner of my office window for that typical week. The first thing to note here is the overall mean of 93.3V/m, this being much higher than the typical background range of 1 – 20V/m quoted by the GOV.UK website, though they do qualify this by stating this may increase to a few hundred volts per metre very close to domestic appliances and power cables. Obviously I’ve gone and plonked my device in a hotspot and it will be interesting to see what readings I obtain in the various rooms around our property.
Before I waded deeper and deeper into unfathomable analysis I decided, on the spur of the moment, to do something simple yet stunningly effective: I pulled the USB cable from the device and, as I did so, I watched the EF values plummet. Aha! Of course! Bob’s yer uncle! Sorted! Bugger!
The shielded USB cable that was delivering 5V DC to the battery charging end-of-things has been mucking up my EF readings big time such that they need to be junked and fresh data collected. In response I set my smartphone alarm to ring at 9pm and 9am every day for two weeks, then at 8pm and 8am for a further two weeks to enable me to plug the USB cable in to download 12 hours of data and charge the battery, then unplug the cable and ride out of Dodge whilst the unit continued to collect untainted data. Mrs Dee asked what all the bleedin’ alarms were for every blasted day, so I also had to dodge a bullet in the form of a stale rock cake.
This rigid regime meant I could flag all readings when the USB cable was inserted and put these at the back of the pantry whilst I analysed cable-free data. Rapid charging (sometimes in as little as 10 minutes) meant I could salvage something from every hour, though there were periods when the battery needed 60 – 90 minutes to regain strength. All in all I managed a near-perfect (‘near’ as in as near as logistically possible) run of 4 weeks precisely, running from 00:00:00 on 1st October to 23:59:59 on 28th October (n=2,419,200).
Just over 2.4 million EMF/EF/RF EMR observations made every second at my office window is a lot of data to play with so I boiled the file down into averages per minute (n=40,320) and averages per hour (n=672) for good measure (see what I did there?)
Holes It is
So let us then have a jolly good look at four week’s worth of rather tedious data collection, starting with a very boring summary table of the 40,320 per minute observations with the USB cable plugged in as well as out:
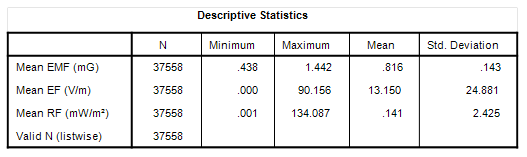
The first thing to notice is there isn’t 40,320 observations here but 37,558, this representing 93.1% data capture rate. The reason for this is that the battery died a couple of times in the wee small hours when I was grabbing my beauty sleep. For some strange reason there is an automatic shutdown protocol if the battery charge drops below 21% (that isn’t mentioned in the manual). This caught me out on three occasions. Grrrr. Then there were three occasions when I accidentally shut down the device by catching the wrong button and not realising for a few hours. Grrrr. So holes it is.
Impact Of The USB Cable
What I’m going to do here is furnish a slide of the mean electric field (V/m) by hour and day to see if we can spot when the cable was plugged in:
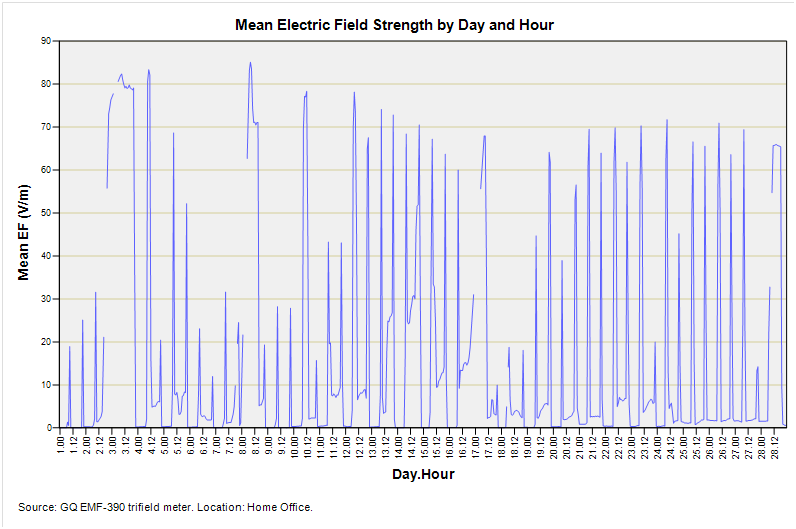
I sure hope folk can spot periods when the cable was plugged in! The word here is scorchio. In terms of overall means then we have an average of 4.5 V/m measured with the USB cable out and 52.3 V/m with the cable in. The interesting thing here is that this huge difference was attained even when the cable was dangling in mid-air and not receiving power from my desktop USB socket i.e. we are talking about the cable acting as a dirty great aerial.
One fun thing I did during periods of analytical boredom was to walk over and give the box a pat with my hand – the values would surge from near zero to +50 V/m thus confirming the ability of humans to act as aerials. These acts of vandalism will show up as spikes when we come to look at the cable-less data series.
So there we go. When the device is left to measure things correctly then the electric field in the vicinity of my office window falls within the 1 – 20 V/m range for households as quoted on the GOV.UK website. No funny business, no hotspot, just plain old appliances doing their thing.
I’m going to guess that at this point a keen reader is going to ask if the USB cable impacted on measurement of EMF and RF EMR. I can see how it would affect the former but not the later owing to its physical size of 2m that is in-keeping with resonance for wavelengths in the VHF range. What we could do here if we’re in a hurry is use a spanner known as MANOVA (multivariate analysis of variance) to see if differences arise to be statistically significant for all three variables of interest. The problem with this is that the distributions of EMF, EF, and RF EMR for plugged-on and unplugged states are not that Normal, as revealed by this natty table:
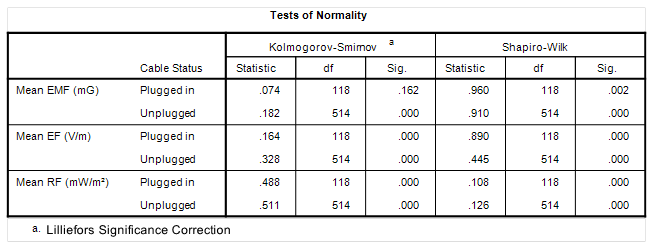
The only data that approaches normality are the plugged-in values for mean hourly EMF (mG), with a p-value of p=0.162 – all the rest reveal deviations from ‘normality’, some significantly so if we care to ogle histograms of data values. This suggests to me that I put the MANOVA spanner back in my bag and pull out GLM (generalised linear modelling) and flip the assumptions that drive the stats module from a Normal distribution to that of Gamma (of which the Normal distribution is a special case). When we do this we discover the following:
Intense innit? Let me decipher…
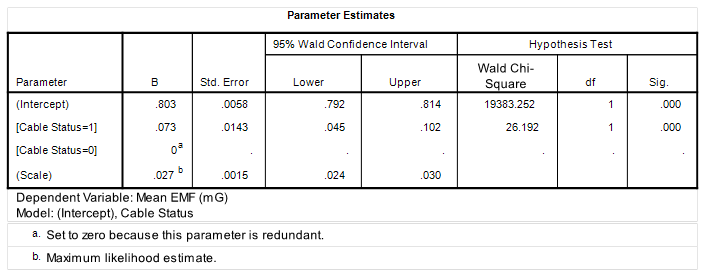
The top table is the GLM output for Mean hourly EMF (mG) over the period 1 – 28 October. See that [Cable Status = 1] entry? That there row refers to measurements made with the USB cable plugged in. We find a coefficient of 0.073 under the column headed ‘B’ that is highly statistically significant (p<0.001 – shown as .000 under the column headed ‘Sig.’). What this means is that the mean hourly EMF with the cable plugged in was, on average, +0.073 mG higher than with the cable unplugged over this period. A small effect granted, but one that isn’t likely due to chance.
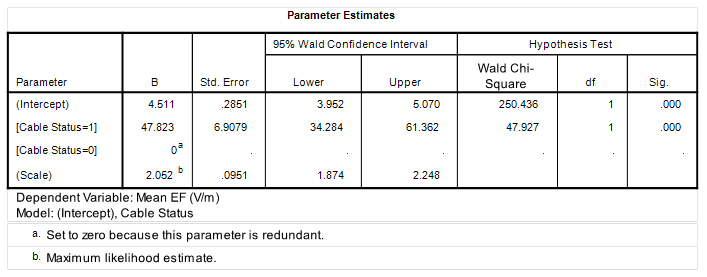
The middle table is the GLM output for Mean hourly EF (V/m) over the same period. That there [Cable Status = 1] row reveals a coefficient of 47.823 under the column headed ‘B’ that is highly statistically significant (p<0.001). What this means is that the mean hourly EF with the cable plugged in was, on average, +47.823 V/m higher than with the cable unplugged over this period. A large effect indeed, as we saw back in the first slide.
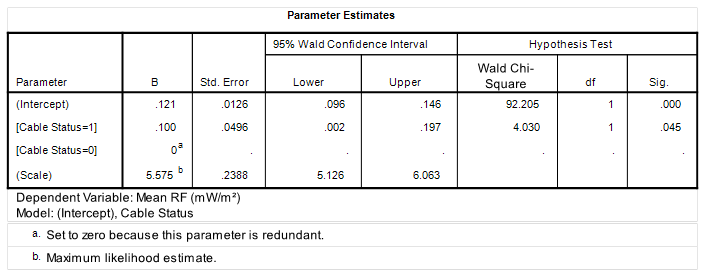
The lower table is the GLM output for Mean hourly RF EMR (mW/m²) ditto. The [Cable Status = 1] row reveals a coefficient of 0.100 under the column headed ‘B’ that is marginally statistically significant (p=0.045). What this means is that the mean hourly RF EMR with the cable plugged in was, on average, +0.100 mW/m² higher than with the cable unplugged over this period, though this difference may have possibly arisen by chance – it’s hard to say.
My Brain Hurts!
I appreciate that brains may hurt after that spot of GLM but the conclusion is quite simple: don’t have the device plugged in if you want accurate measurements. And don’t hold it neither!
What I better do is leave it at that for today and start straight in next time with time series analysis of the unplugged data for those four weeks in October, for right now the shift from British Summer Time to Greenwich Mean Time is playing havoc with my stomach that angrily wants to know why I’m on a starvation diet.
Kettle On!