Temporal Variation In Non-Ionising Radiation At A Single Location (part 3)
Introducing the GQ Electronics EMF-390 multifunction meter that logs the electromagnetic field (EMF), the electric field (EF) and the radio frequency field (RF EMR) simultaneously every second
Today we are going to look at the output of another lavish device that sits here in my office window; we are talking about the GQ Electronics EMF-390 trifield multifunction meter, details of which may be found here. I appreciate that there are geeks, nerds and bods out there in cyberspace and they just might have an inclination to ogle the manual that I have placed on my Google drive right here. Here’s the opening salvo from the user manual…
The GQ EMF-360V2 / EMF-360+V2 / EMF-380V2 / EMF-390 advanced multi-function digital EMF meter is designed and developed by GQ Electronics, Seattle, USA. It is designed to be a portable and convenient device. It can be used as regular EMF, EF and RF radiation detection. This high sensitivity meter lets you check EMF/RF radiation easily. Examples: computer mouse, car remote key, cell phone, cell tower, cordless phone, static, electric field, WiFi, computer laptop, microwave, electric heater, hair dryer, vehicle engine, light, outdoor power line, monitor the WiFi signal, smart meter signal, spy wireless video camera signal, even track radio signal in air.
The meter features multiple sensors to ensure maximum scale/range measurement and highest accuracy:
Three axis Electromagnetic Fields
Electric Field
Radio Frequency
Additionally, the testing features also include:
Radio Spectrum Power Analyzer (EMF-360+V2/380/390 only)
Real-time (every second) data logging (EMF-390 only).
The meter is able to identify the common source from EMF/RF measured, such as Power Line, WiFi/Cell phone, Cell Tower, Microwave etc. It also comes with built-in audible and visual alarm. The device can be used for EMF, EF and RF detection and monitoring, both indoors and outdoors (the unit must be protected from rain), as well as in other similar environments. The device also features a high contrast black/white LCD module and one front LED indicator. The unique GQ RF Browser feature allows to visualize the RF radiation precisely with an on-screen graph. With the RF Browser, the user is able to see the Digital RF equivalent in bytes as well as an RF power spectral histogram. The EMF-380V2 and EMF-390 come with an on-board real time clock for time related data measurements.
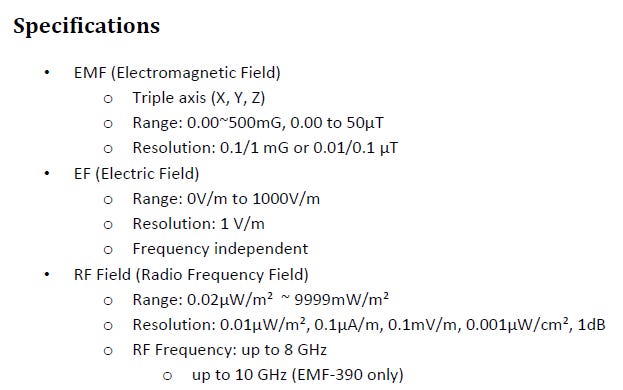
So there you go. It’s quite a fabulous little device and interfaces with my workstation via a USB. Bod-geeks will want to know the basic specs, so here they are:
The only criticism I shall level at it for now is that there’s no way of changing the sampling resolution which, as the blurb states, is set at each second (i.e. there’s no averaging function), and it only stores 20 hours of data. To obtain an uninterrupted sample I’m downloading at 3pm each afternoon then again at 9am the next morning in order to squeeze in an 18-hour overnight run. A third gripe is the naming convention for the CSV output files, this being MMDDYYYY_HHMMSS and not YYYYMMDD_HHMMSS, but hey ho, nonny, nonny, nonny etc.
I purchased the unit back in March 2024 and my very first record is timestamped 26/3/2024 11:51:15. Data collection since then hasn’t been continuous, with flurries of activity in April and May, then more consistently this month in order to generate some meaty data for this report. During this time the Dee household has mostly run as normal, with the occasional switching-on and off of certain appliances and devices to see what they’re generating. Thus the data sample is an utter hotch-potch of probing and observing but it does offer an insight into the EF/EMF/RF EMR profile of my office, and thus our home and our semi-rural neighbourhood.
Later on I shall be using the meter for more specific measurements of the following devices:
Wi-Fi router
4G Android
Laser printer
Dual screen workstation
Office paper shredder
Vacuum cleaner
Washing machine
Dishwasher
Electric kettle
Electric blender
Electric toaster
Electric oven
RF controlled C/H boiler
LCD television
Electric drill (corded)
Electric toothbrush/charger
Cordless shaver/charger
Air purifier
I’m also planning on measuring background EF/EMF/RF EMR during ‘silent running’, when the big red switch on the mains A/C board will be thrown and the entire house descends into electrical stillness. The dangers here are trashing Mrs Dee’s UK Freeview recording schedule (we never watch live TV these days), putting the house into utter darkness (big toe stubbing risk) and wrecking the contents of the freezer.
Still, it could be worse… I could be flying a kite with a ground wire in order to experiment with static electricity. Oooeer!
My most daring experimental adventure is likely to be sampling the profile of traffic zipping along the local bypass in order to observe the influence (or not) of EVs, though for this assessment I’ll likely start out nice and easy in the local supermarket car park (easy access to biscuits). So how about we get that kettle on, open that big tin of choccie Christmas biscuits that have already gone on sale, and go look at some data?
Data Sample
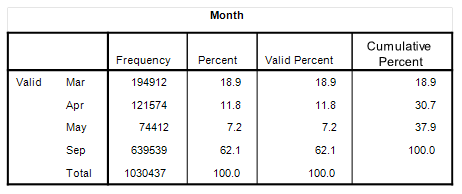
We’re looking at a lot of data. The sum total of 1,030,437 observations to be precise; the lion’s share of which was recorded this very month (62.1%). Since I didn’t engage in any weird appliance fiddling this month and just let the device quietly do its thing in the corner of my office whilst we got on with the business of gardening, baking cakes, taking hot Epsom salt soaks, running logistic regressions, and watching MasterChef, then I suggest we stick to analysing those 639,539 ‘normal’ records for the period 10 – 18th September.
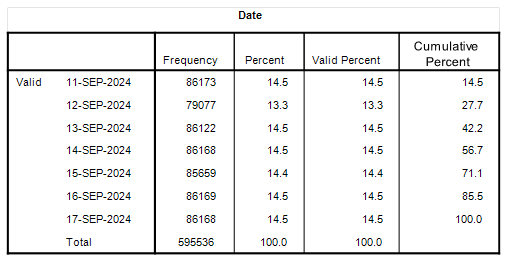
If we want to go one step further we might consider looking at whole day logging only, for my device kicked-off logging at 21:07:17 on Tuesday 10th, with the final sample arriving this fine morning at 09:22:38, with the period 11 – 17th Sep offering full 24-hour logs. This is how this looks:
Folk like me are going to figure that 24 hours contains 86,400 seconds and so each day should possess this number of records. Except they don’t. The poor showing of 12th Sep is down to me messing with the unit and being rather slow and losing 7,323 records, this representing just over 2 hours of data. As for the ‘good’ days the unit managed 86,172/86,400 (99.7% capture rate) at best with just 228 records missing representing around 4 minutes. Quite why these sporadic holes appear isn’t clear at this point but I shall be chasing the matter with the GQ support crew.
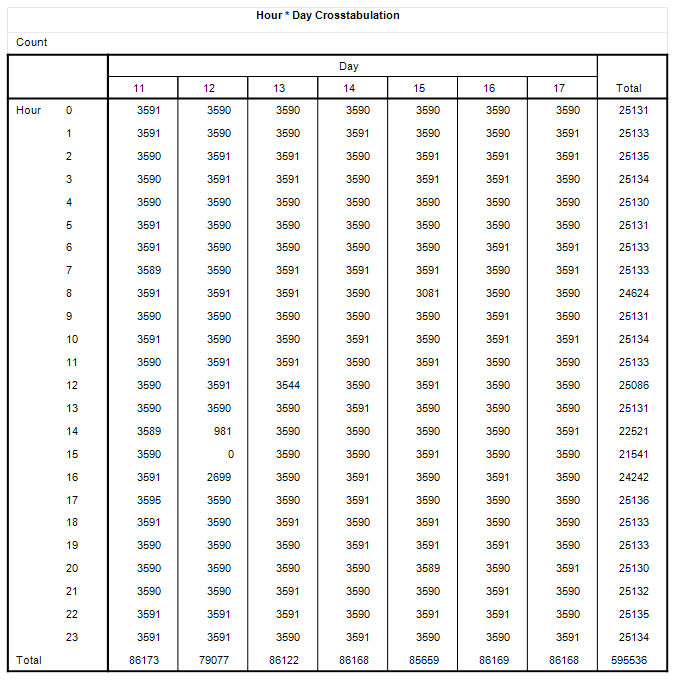
If I cross-tabulate day of month by hour of day then we see a consistent pattern of ~3,590 records per cell instead of 3,600 which suggests around 10 records are lost pretty much every hour for some unknown reason. You can see my blooper sticking out like a sore thumb at between 2pm and 4pm on Thursday 12th.
If I drill down further and cross-tabulate day by hour by minute then the odd hole crops up pretty much randomly across the matrix of 10,080 cells so it isn’t a systematic thing like a wobbly every hour on the hour.
And now I think some colourful slides are in order!
Time Series for EMF, EF & RF EMR components
My graphing module would take a lifetime to plot out 595,536 points so I’ve taken the liberty of crunching mean values per hour, this rendering a manageable processor workload (n=168).
Electromagnetic Field Strength
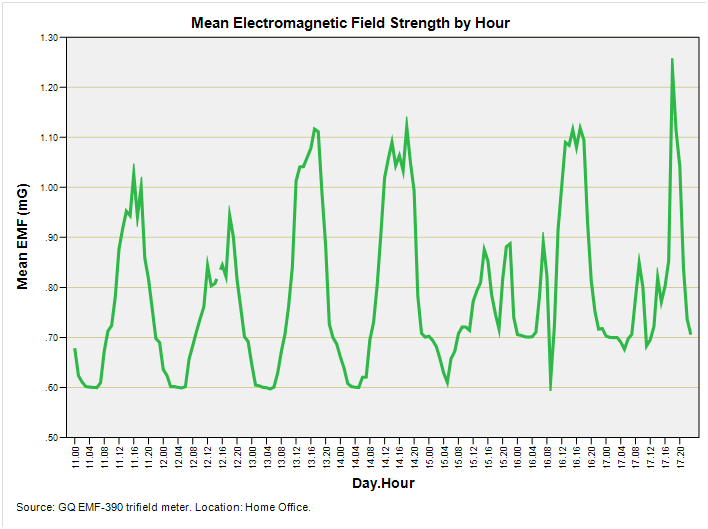
Well there you go! There’s a well-defined daily pattern that peaks around 4pm each day, with 4am being the low point. That there daily peak didn’t happen at 4pm on Sunday 15th because we were not at home from 9am – 8pm that day and appliances were turned off as much as can be (excluding the fridge, freezer, boiler and freeview recorder, of course!). This gives a first glimpse at background levels but I shall pursue this in earnest when I throw that big red switch.
I have no idea what was happening at 6pm on Tuesday 17th but we’d obviously turned something electro-noisy on! More detective work of this nature is to follow as will an assessment of the overall level of EMF across the week, whose mean fetches up at 0.78mG. When I can find the time I’ll go sit in a remote field and see what nature-boy figures I get.
Electric Field Strength
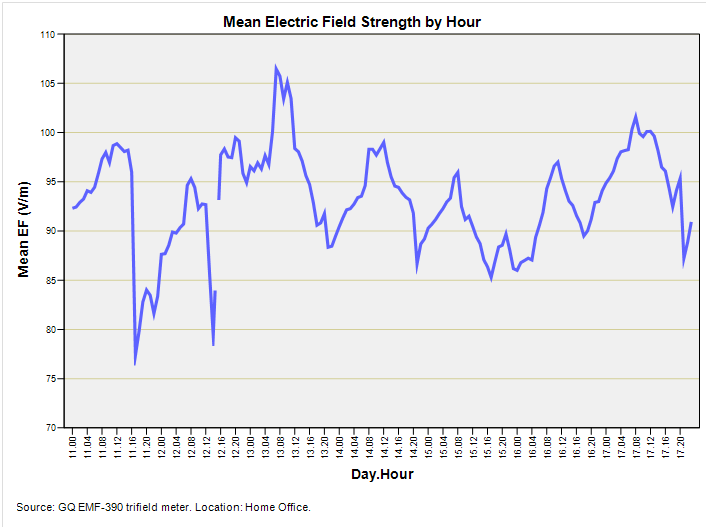
No obvious regular daily pattern is seen with electric field strength but I’m sure there is something here to squeeze out in the next article. Our absence on Sunday 15th is also less dramatic. What fascinates are those two sharp dips at 5pm on Wednesday 11th and 2pm on Thursday 12th – I shall be delving further! The series mean fetches up at 93.3V/m, which seems rather a lot so I may need to reconsider the siting of the device. Then again I ought to check values at various points around the house and garden as well as that remote field.
Radio Frequency EMR
So this is yer 5G, 4G, 3G, 2G and all the rest of the RF riff-raff innit?
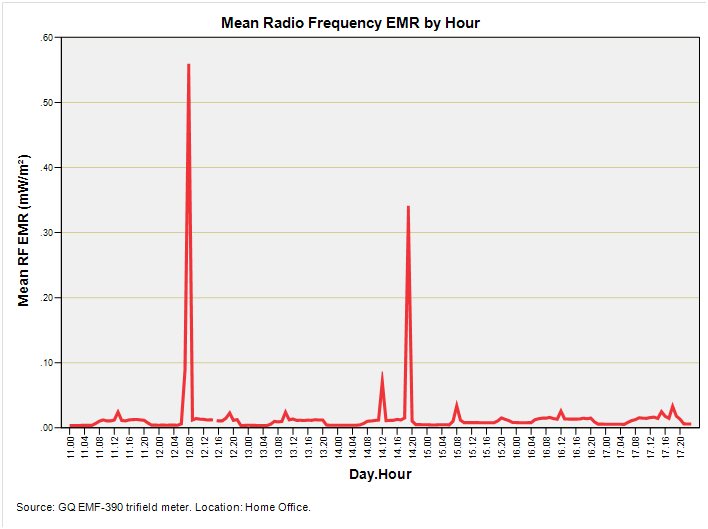
I think you can see when I turned on the Wi-Fi box and two Android phones, and I think you can see when Mrs Dee put her phone near the device. Those weeny spikes might well be me emailing folk from the garden and they could be tech-savvy passers-by: there’s a lot more to come, folks!
Well dangnabbit, I’ve run out of time for this week – 3pm has come and gone and I’m still typing. I shall stop right here and reach for my favourite appliance…
Kettle On!


