
Dirty Electricity (part 2)
Today I continue looking for temporal patterns in the distribution of dirty electricity

We’ve seen evidence of hour-of-day and month-of-year effects, and so today I’d like continue thrashing through the data by looking at day of week and then zooming out to see if there are any long term trends.
Without further ado, here’s an error bar plot for day of week...
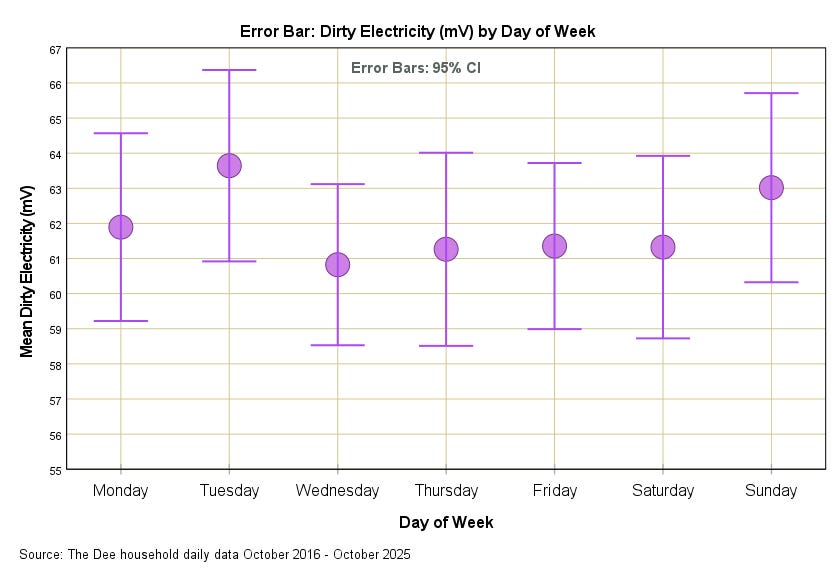
I’m glad I didn’t bet on this because I’d have plonked for Saturday or Monday as being particularly dirty days... but Tuesday it is (though the 95 percentile error bars are quite wide and this brings into question the statistical significance of any differences we see). I guess we better check…
Fry Up
I think at this point that a shallow-fried ANOVA (analysis of variance) might be in order, but in order to stop this falling apart at the seams I’m going to do a bit of recoding.
Month – a 12-factor variable – will be transformed into the 4-factor variable that is season; and hour of day – a 17-factor variable – will be transformed into the 3-factor variable that is Period (6am – 11am, 12pm – 5pm, and 6pm – 11pm). In doing so our demand on the ANOVA procedure drops from a 12 x 17 x 7 = 1,428 partition design to 4 x 3 x 7 = 84 partition design, and we’re thus likely to get something meaningful that isn’t based on a bunch of empty cells.
Here’s the nubbins...
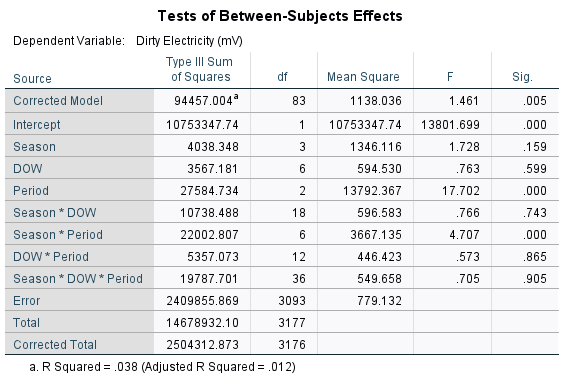
Aside from a statistically significant intercept (a.k.a constant) at p<0.001 there are only two significant effects, these being period (p<0.001) and its interaction with season (p<0.001). We’ve seen the variation across the day so let’s look at the estimated marginal means (EMM) plot.
A quick word about EMMs...
EMM Plots
Estimated marginal means (EMMs) are predictions from a linear model, usually adjusted for the means of other factors in the model. They are useful for describing the effects of factors in a model. In a model with just a single factor the marginal means and observed means will be the same. However, if there are other factors in the model, the estimated marginal means will differ from the observed means, and will reflect the adjusted means for each group of the factor of interest. When a covariate is included in a model the estimated marginal means are adjusted for the covariate. By default EMMs are calculated at the mean of the covariate, allowing for the assessment of the adjusted effect of the factor of interest. In essence, estimated marginal means provide a way to understand the main effects of factors in a model, by accounting for the impact of other variables.
And now for the plot…
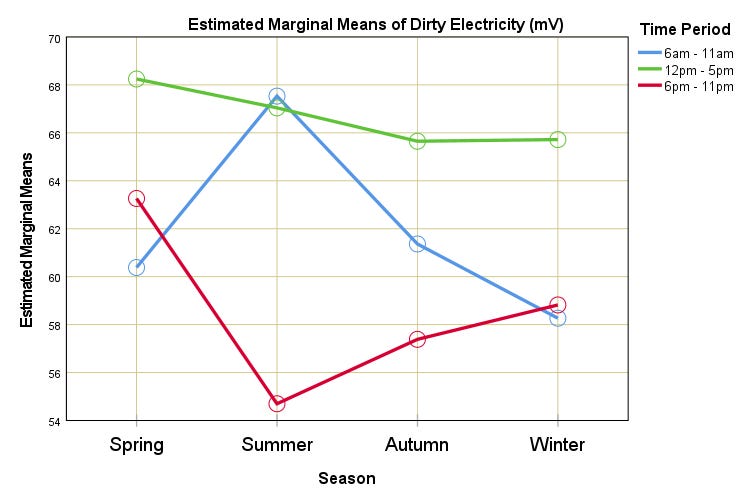
Interactions on an estimated marginal means (EMM) plot such as this are characterised by crossing lines, diverging lines or converging lines – and there’s plenty of this about!
If we start with the green line representing the hours 12pm – 5pm we see very little change to the mean level of dirty electricity across all four seasons. This is not the case with the morning period of 6am – 11am which sees peak trash on the A/C ring main during summer, and minimum trash during winter. We see the inverse of this seasonal affect for the period 6pm – 11pm which dips in summer.
We may conclude that summer is a standout month for dirty electricity in that there is something special we’re doing to generate it in the morning that disappears by the evening. This will be partly due to the Dee household use of appliances, but it will also be influenced by the condition of the A/C mains in the neighbourhood all the way back to the substation.
With the nubbins out of the cupboard and on the table one last fry-up, temporally-speaking, is to check for long term trends, and for this I’ve derived the time series that is mean dirty electricity per month for the period October 2016 – October 2025:
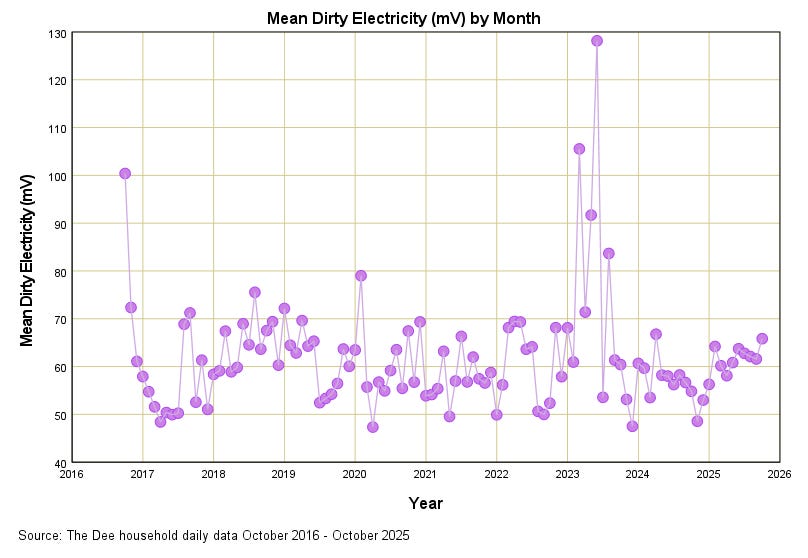
And there it is. Fortunately I’m in a position to know exactly what was causing the hullabaloo back in 2023, for this was when we decided to run a sizeable air purifier in an attempt to alleviate Mrs Dee’s hay fever. That mish mash is what one big motor can do to the entire ring main. Outside of this, and a couple of other periods when the whopper air purifier was employed, there’s no obvious sign of a long term trend either way. Dirty electricity is what it is in our household.
Being Curious
I am sure there are readers of this series who are most curious to know what sort of impact mains filtering can have on levels of dirty electricity. All of the results you see are derived from filtered ring mains, with a single filter on the upper floor and two filters on the ground floor. What I shall do, therefore, is wrap-up the article right now and go in search of my earliest observations. Until then...
Kettle on!
Just throwing this into the mix, could there be a connection between the quality of electricity during the summer months when the wind turbines are virtually still, as compared to winter? Apparently, 25% of our bill amounts are for 'renewables', throughout the year... so what do they do when the wind doesn't blow, methinks? Just chuck in some dirty stuff?
Of course, I should add, I haven't a clue about how electricity actually works... but then, not many do.